


Project/Slides/Presentation Transcript
Topic: Bajaj Finserv Revenue segmentation, Cost analysis & Regression analysis
INTRODUCTION
Bajaj Finserv was formed in April 2007 as a result of its demerger from Bajaj Auto Limited to further the Group’s interests in financial services.
Bajaj Finserv Limited is the holding company for the businesses dealing with financial services of the Bajaj Group.
Three key financial sector are
- Bajaj Finance Ltd.
- Bajaj Allianz Company Ltd (Life Insurance)
- Bajaj Allianz General Insurance Company (General Insurance)
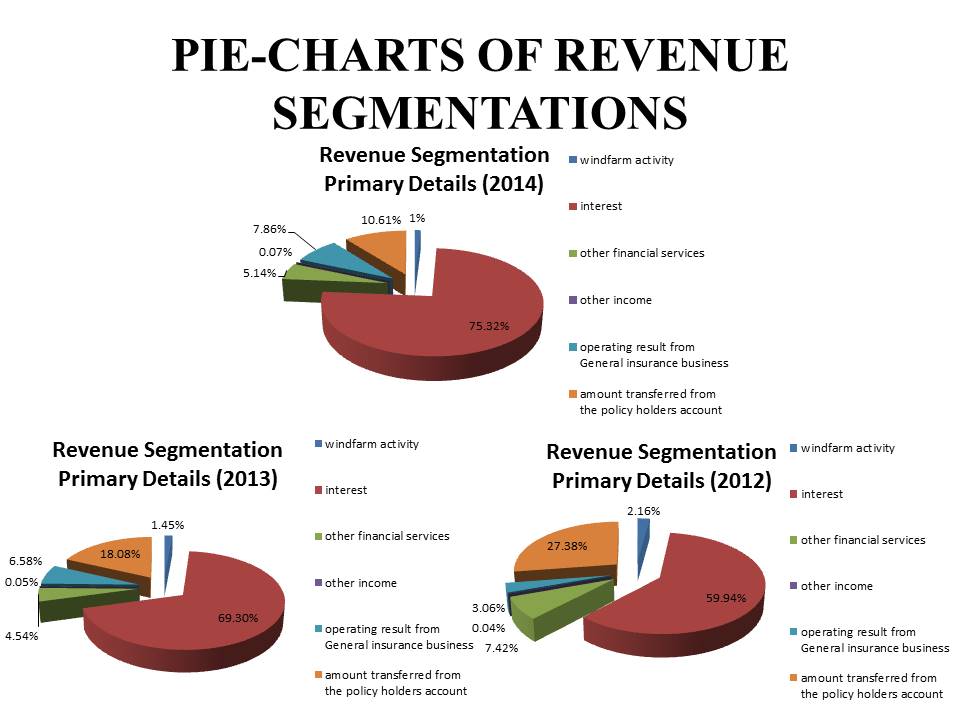
REVENUE SEGMENTATION
| REVENUE SEGMENTATION OF BAJAJ FINSERV (PRIMARY DETAILS) | |||||||||
| 2014 | 2013 | 2012 | |||||||
| S.No. | CATEGORY | AMOUNT (IN RS. CRORES) | PERCENTAGE OF REVENUE | GROWTH (YOY) | AMOUNT (IN RS. CRORES) | PERCENTAGE OF REVENUE | GROWTH (YOY) | AMOUNT (IN RS.CRORES) | PERCENTAGE OF REVENUE |
| 1 | REVENUE FROM OPERATION | ||||||||
| A. | WINDFARM ACTIVITY | 60.44 | 1.00% | -0.45% | 73.38 | 1.45% | -0.71% | 84.37 | 2.16% |
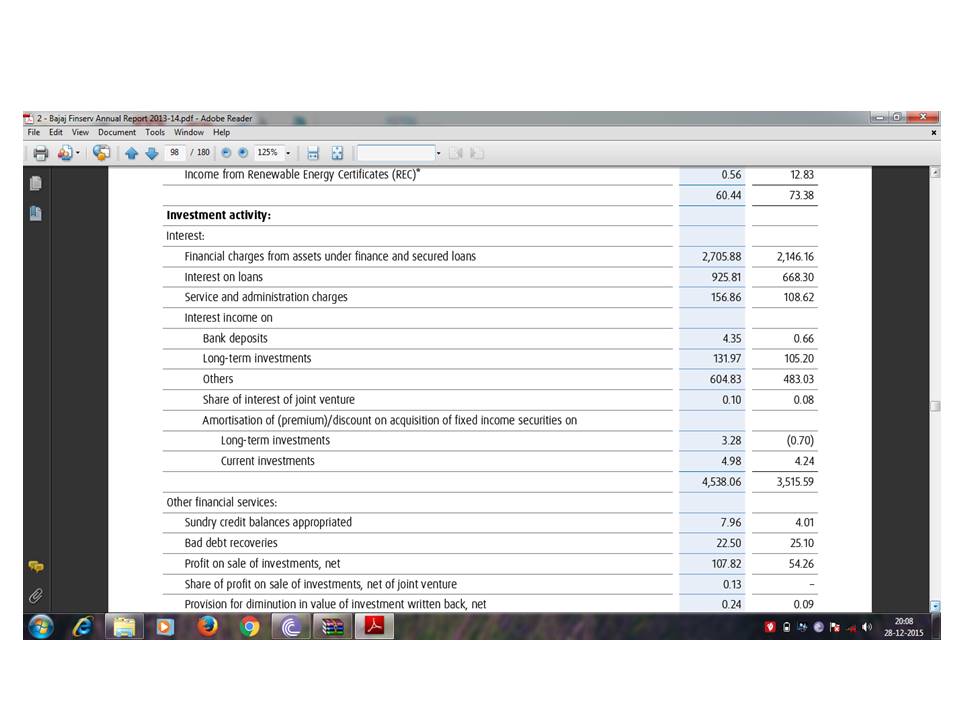
| B. | INVESTMENT ACTIVITY | ||||||||
| I. | INTEREST | 4538.06 | 75.32% | 6.02% | 3515.59 | 69.30% | 9.36% | 2340.44 | 59.94% |
| II. | OTHER FINANCIAL SERVICES | 309.51 | 5.14% | 0.60% | 230.41 | 4.54% | -2.88% | 289.81 | 7.42% |
| 2 | OTHER INCOME | 3.97 | 0.07% | 0.02% | 2.46 | 0.05% | 0.01% | 1.73 | 0.04% |
| 3 | OPERATING RESULT FROM GENERAL INSURANCE BUSINESS | 473.91 | 7.86% | 1.28% | 333.86 | 6.58% | 3.52% | 119.3 | 3.06% |
| 4 | AMOUNT TRANSFERRED FROM THE POLICY HOLDERS ACCOUNT | 639.1 | 10.61% | -7.47% | 917.48 | 18.08% | -9.30% | 1069.13 | 27.38% |
| TOTAL REVENUE | 6024.99 | 100.00% | 5073.18 | 100.00% | 3904.78 | 100.00% | |||
ANALYSIS
Reasons for Decline in Growth –
- Due to the sudden drop in the demand for renewable energy certificates(RECs) on the energy exchange during the year , there was a decline in wind farm activities.
- Industry specific changes triggered in 2014 and set of regulations were issued on par and non par offering which led to the loss of several flagship product across the industry.
- There was decline in all sector because of the significant decline in car and motor sales.
- The various other reasons are:-
- Political uncertainties.
- Overhang of many corruption scandals.
- Government ability to take decision went into deep freeze.
- Danger of high inflation.
- RBI responded swiftly by tightening monetary policy.
Reason for the Growth in Investment Activity –
- Bajaj Finance Ltd. launched its fixed deposit programme as an anchor wealth management product in 2014.
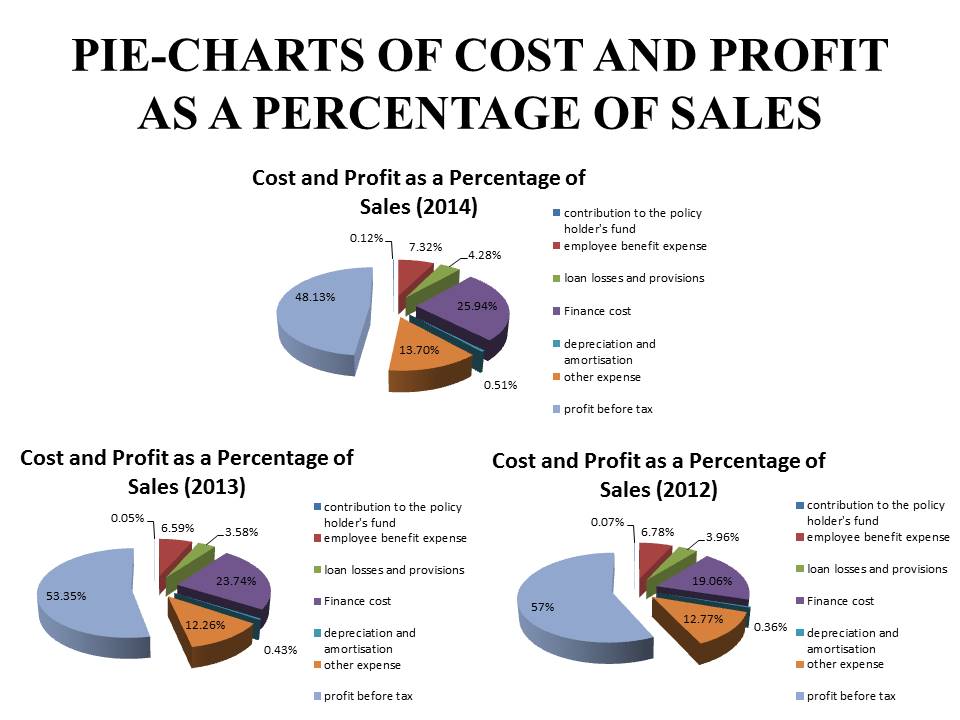
COST COMPONENT STRUCTURE
| COST STRUCTURE OF BAJAJ FINSERV | |||||||||
| 2014 | 2013 | 2012 | |||||||
| S.NO. | COST COMPONENTS | AMOUNT (IN RS. CRORES) | COST AS A % OF SALES | GROWTH (YOY) | AMOUNT (IN RS. CRORES) | COST AS A % OF SALES | GROWTH (YOY) | AMOUNT (IN RS. CRORES) | COST AS A % OF SALES |
| EXPENSES | |||||||||
| I. | CONTRIBUTION TO THE POLICY HOLDER’S FUND | 6.94 | 0.12% | 0.07% | 2.35 | 0.05% | -0.02% | 2.85 | 0.07% |
| II. | EMPLOYEE BENEFIT EXPENSE | 440.73 | 7.32% | 0.73% | 334.28 | 6.59% | -0.19% | 264.7 | 6.78% |
| III. | LOAN LOSSES AND PROVISIONS | 257.81 | 4.28% | 0.70% | 181.75 | 3.58% | -0.38% | 154.38 | 3.96% |
| IV. | FINANCE COST | 1561.87 | 25.94% | 2.20% | 1203.58 | 23.74% | 4.68% | 744.1 | 19.06% |
| V. | DEPRECIATION AND AMORTISATION | 30.88 | 0.51% | 0.08% | 21.69 | 0.43% | 0.07% | 14.12 | 0.36% |
| VI. | OTHER EXPENSE | 825.15 | 13.70% | 1.44% | 621.42 | 12.26% | -0.51% | 498.41 | 12.77% |
| PROFIT BEFORE TAX | 2897.64 | 48.13% | -5.22% | 2705.65 | 53.35% | -3.65% | 2224.49 | 57.00% | |
| SALES | 6021.02 | 100.00% | 5070.72 | 100.00% | 3903.05 | 100.00% | |||
ANALYSIS
- 2012 has been a very difficult year for the Indian economy. After clocking 8.6% GDP growth in 2011, the nation seem to be slumped, growth has fallen steadily to 6.5%.
- Along with slowdown in growth, it was a selerotic pace at which decisions were taken in New Delhi.
- High interest rates
- Declining inflows of Foreign Direct and institutional investments
- Widening current account deficit & weakening rupees.
- Worsening investment climate and fears of rising inflation.
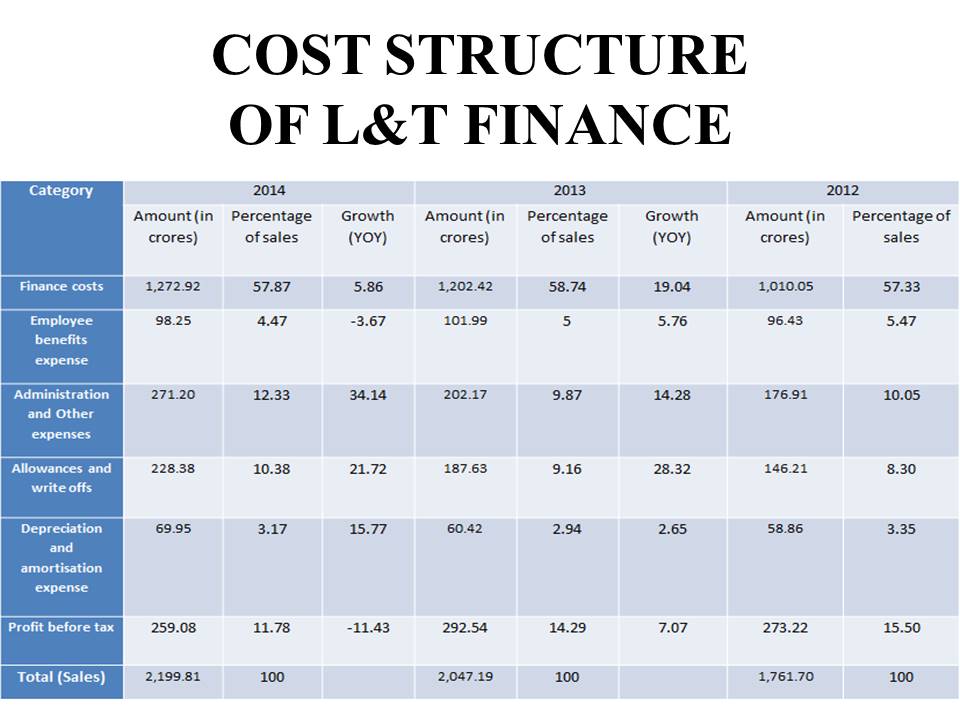
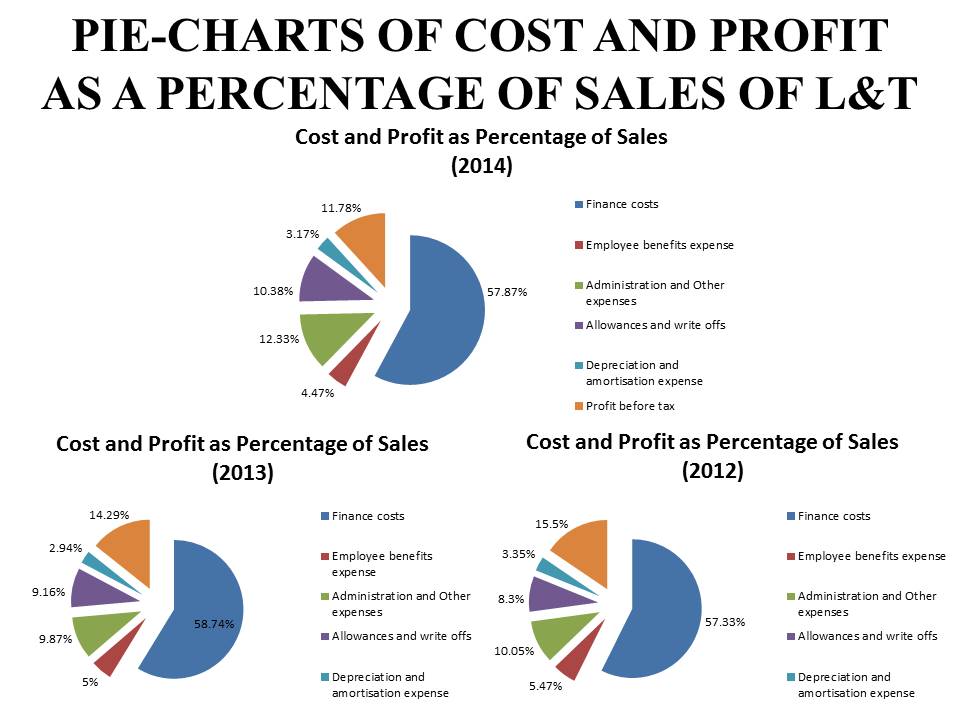
COST STRUCTURE OF L&T FINANCE
ANALYSIS
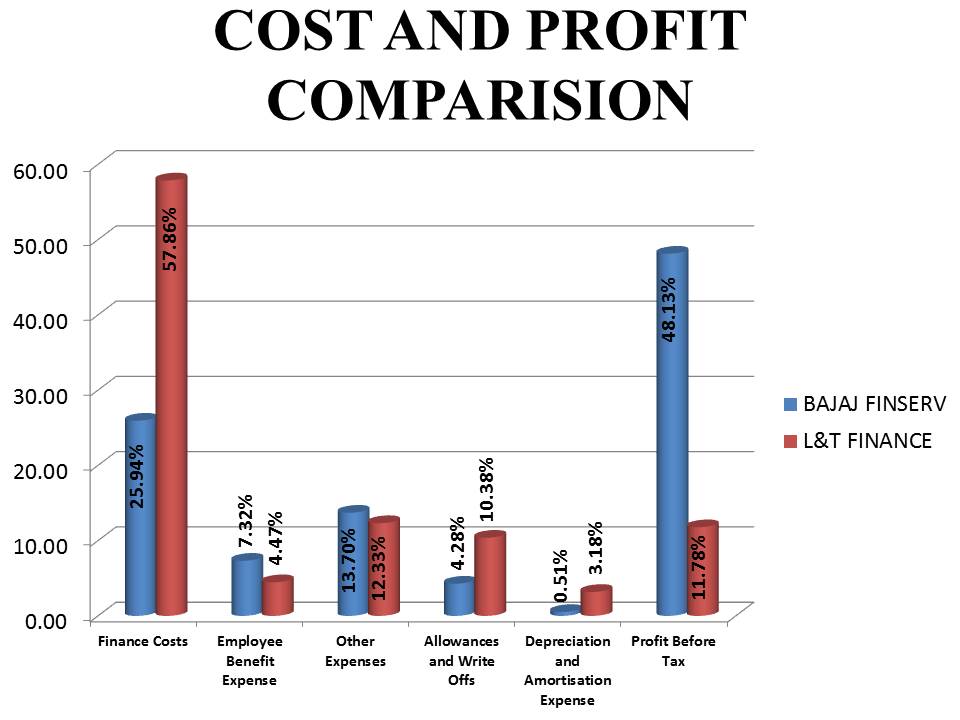
Reasons for Higher Profit as Compared to L& T Finance –
- It issued 6.7 million policies in 2014 versus 6.3million in 2013
- Companies strong underwriting and claim management skills led to ROE of 28%.
- Technological innovation such as the Ezee TAB platform for policy issuance & claim settlement.
- Emphasizing uniformly high quality customer service.
- Company launched a new product “Kisan Mitra” for farmers where repayments of installment are synchronised to realisation from crops.
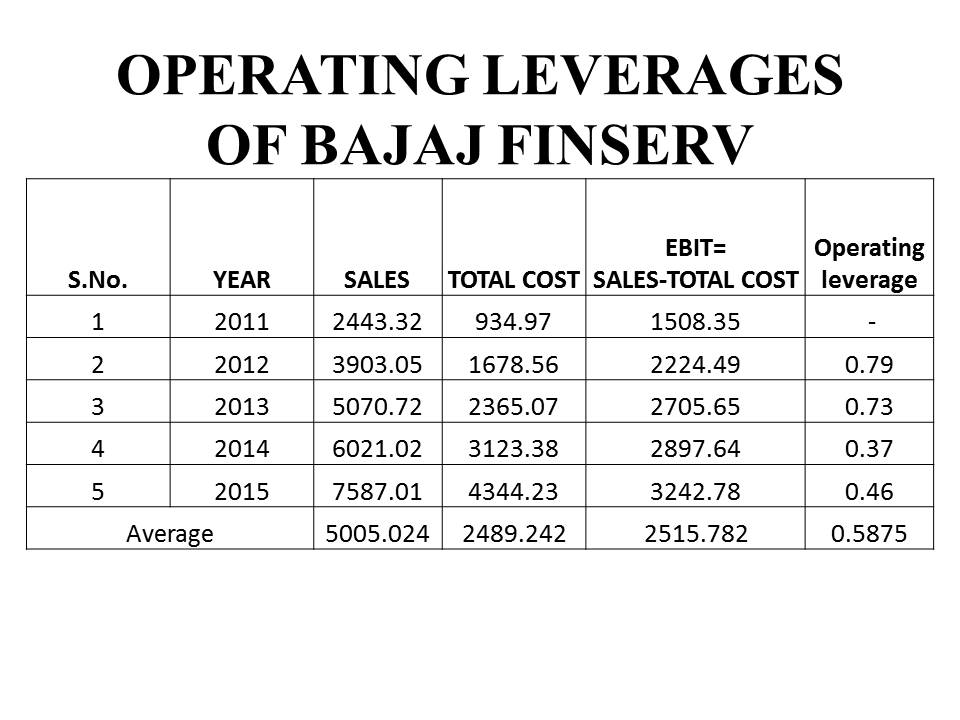
OPERATING LEVERAGES OF BAJAJ FINSERV
| S.No. | YEAR | SALES | TOTAL COST | EBIT= SALES-TOTAL COST | Operating leverage |
| 1 | 2011 | 2443.32 | 934.97 | 1508.35 | – |
| 2 | 2012 | 3903.05 | 1678.56 | 2224.49 | 0.79 |
| 3 | 2013 | 5070.72 | 2365.07 | 2705.65 | 0.73 |
| 4 | 2014 | 6021.02 | 3123.38 | 2897.64 | 0.37 |
| 5 | 2015 | 7587.01 | 4344.23 | 3242.78 | 0.46 |
| Average | 5005.024 | 2489.242 | 2515.782 | 0.5875 | |
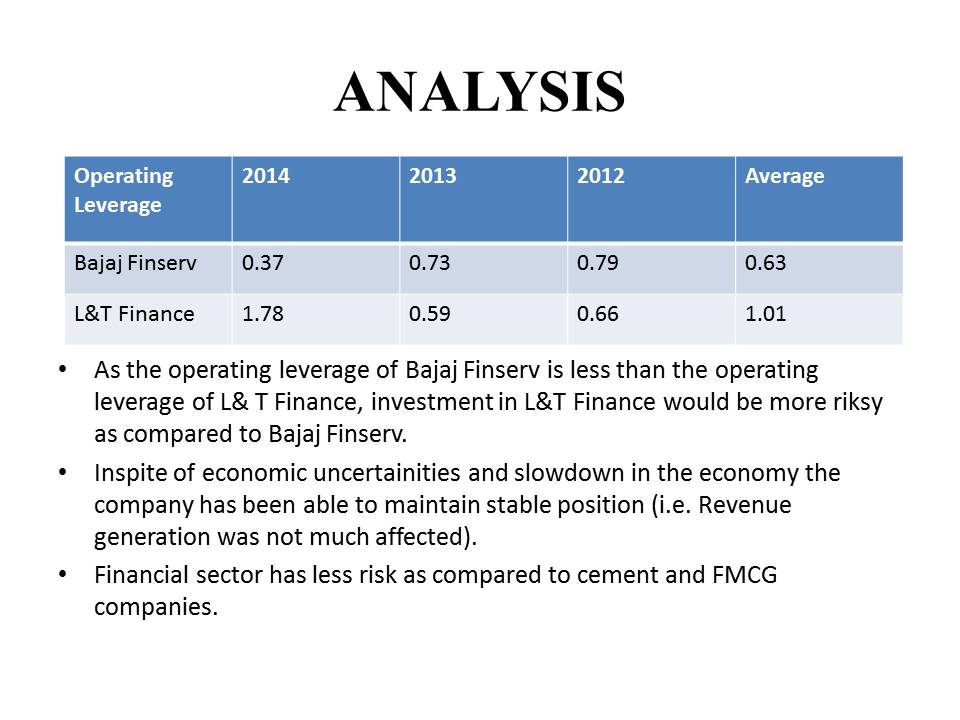
ANALYSIS
- As the operating leverage of Bajaj Finserv is less than the operating leverage of L& T Finance, investment in L&T Finance would be more riksy as compared to Bajaj Finserv.
- Inspite of economic uncertainities and slowdown in the economy the company has been able to maintain stable position (i.e. Revenue generation was not much affected).
- Financial sector has less risk as compared to cement and FMCG companies.