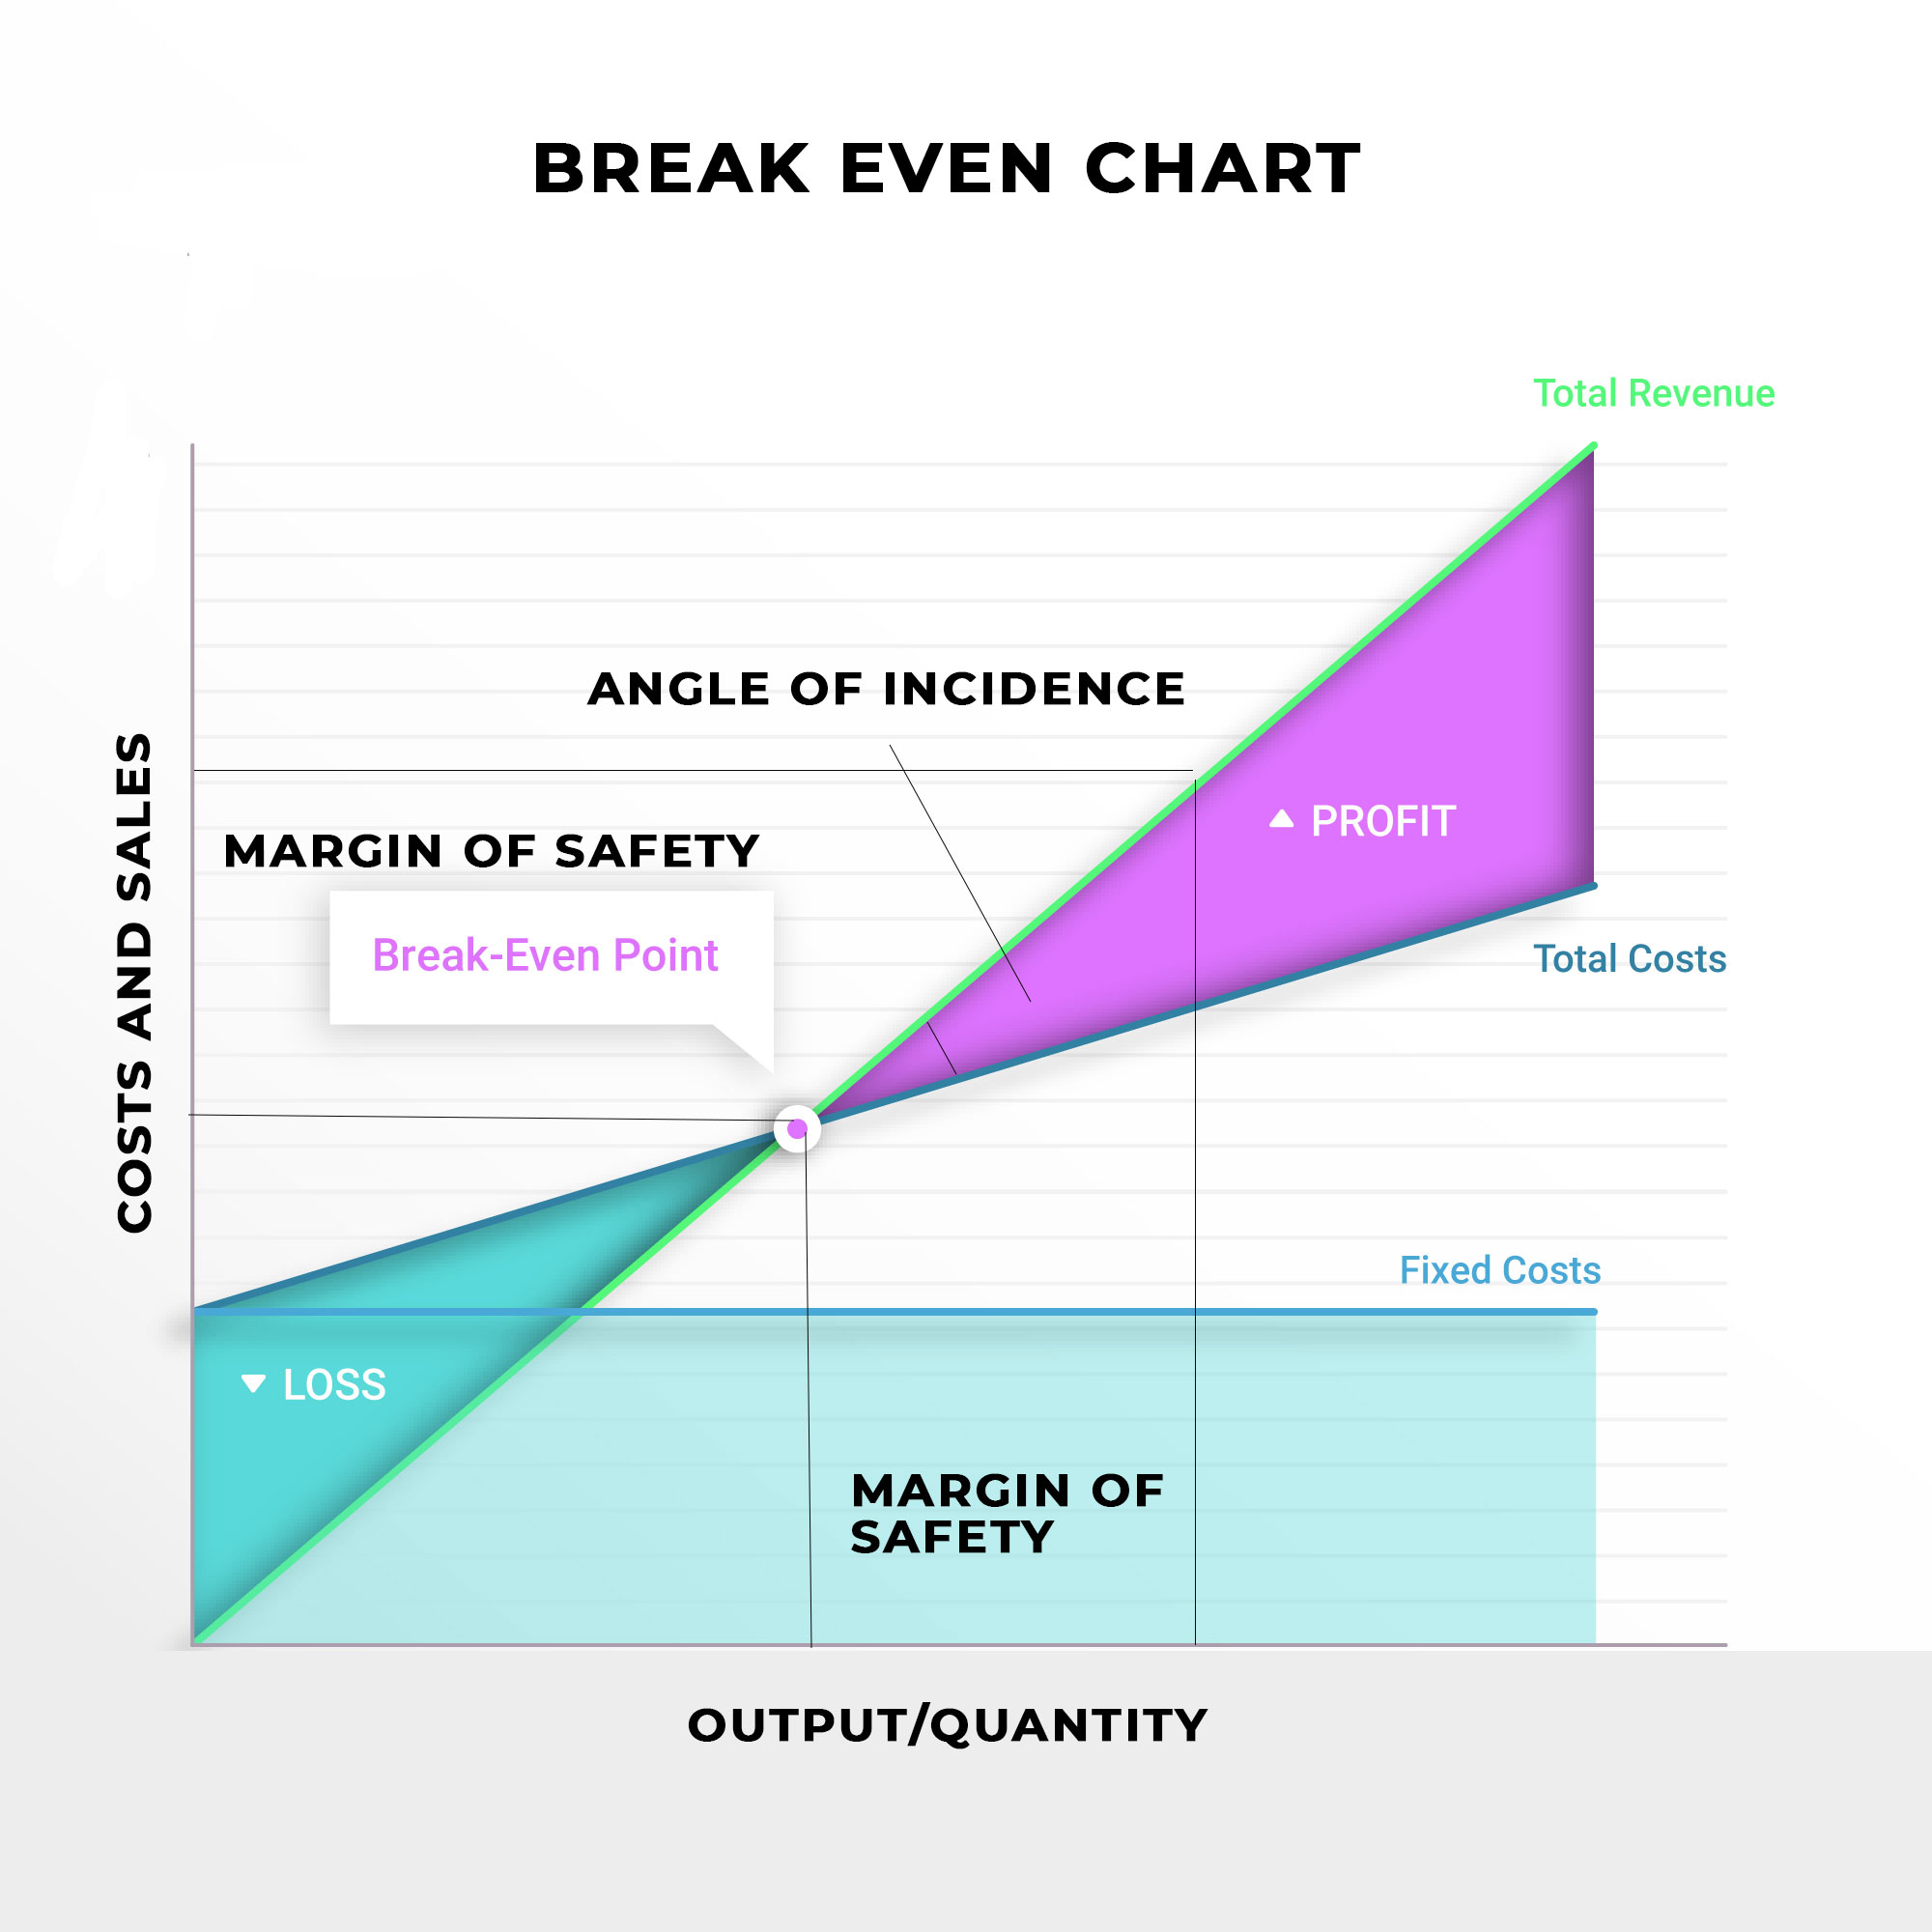
In a break-even chart, the angle of incidence is formed at the break-even point where the total cost line intersects the total sales line. This angle shows the rate of profit earning of the company.
Basically the angle of incidence forms when the company’s sales line intersects with the company’s cost line from below in a break-even chart. The angle which is created by cost and sales line is called the angle of incidence. This angle is formed from the starting of a break-even point. The angle of incidence shows the rate at which a company is making profits.
The simple rule is that the bigger the angle of incidence higher is the rate of profit. A large angle of incidence indicates a company is making a profit at a higher rate similarly, a small angle of incidence shows that a company is making a profit at a lower rate. A small angle of incidence also shows that a company is incurring more variable costs. The best situation for a company is to have a big angle of incidence.
For a better understanding angle of incidence, we need to understand –
- Break-even Point
- Break-even Chart
- Margin of Safety
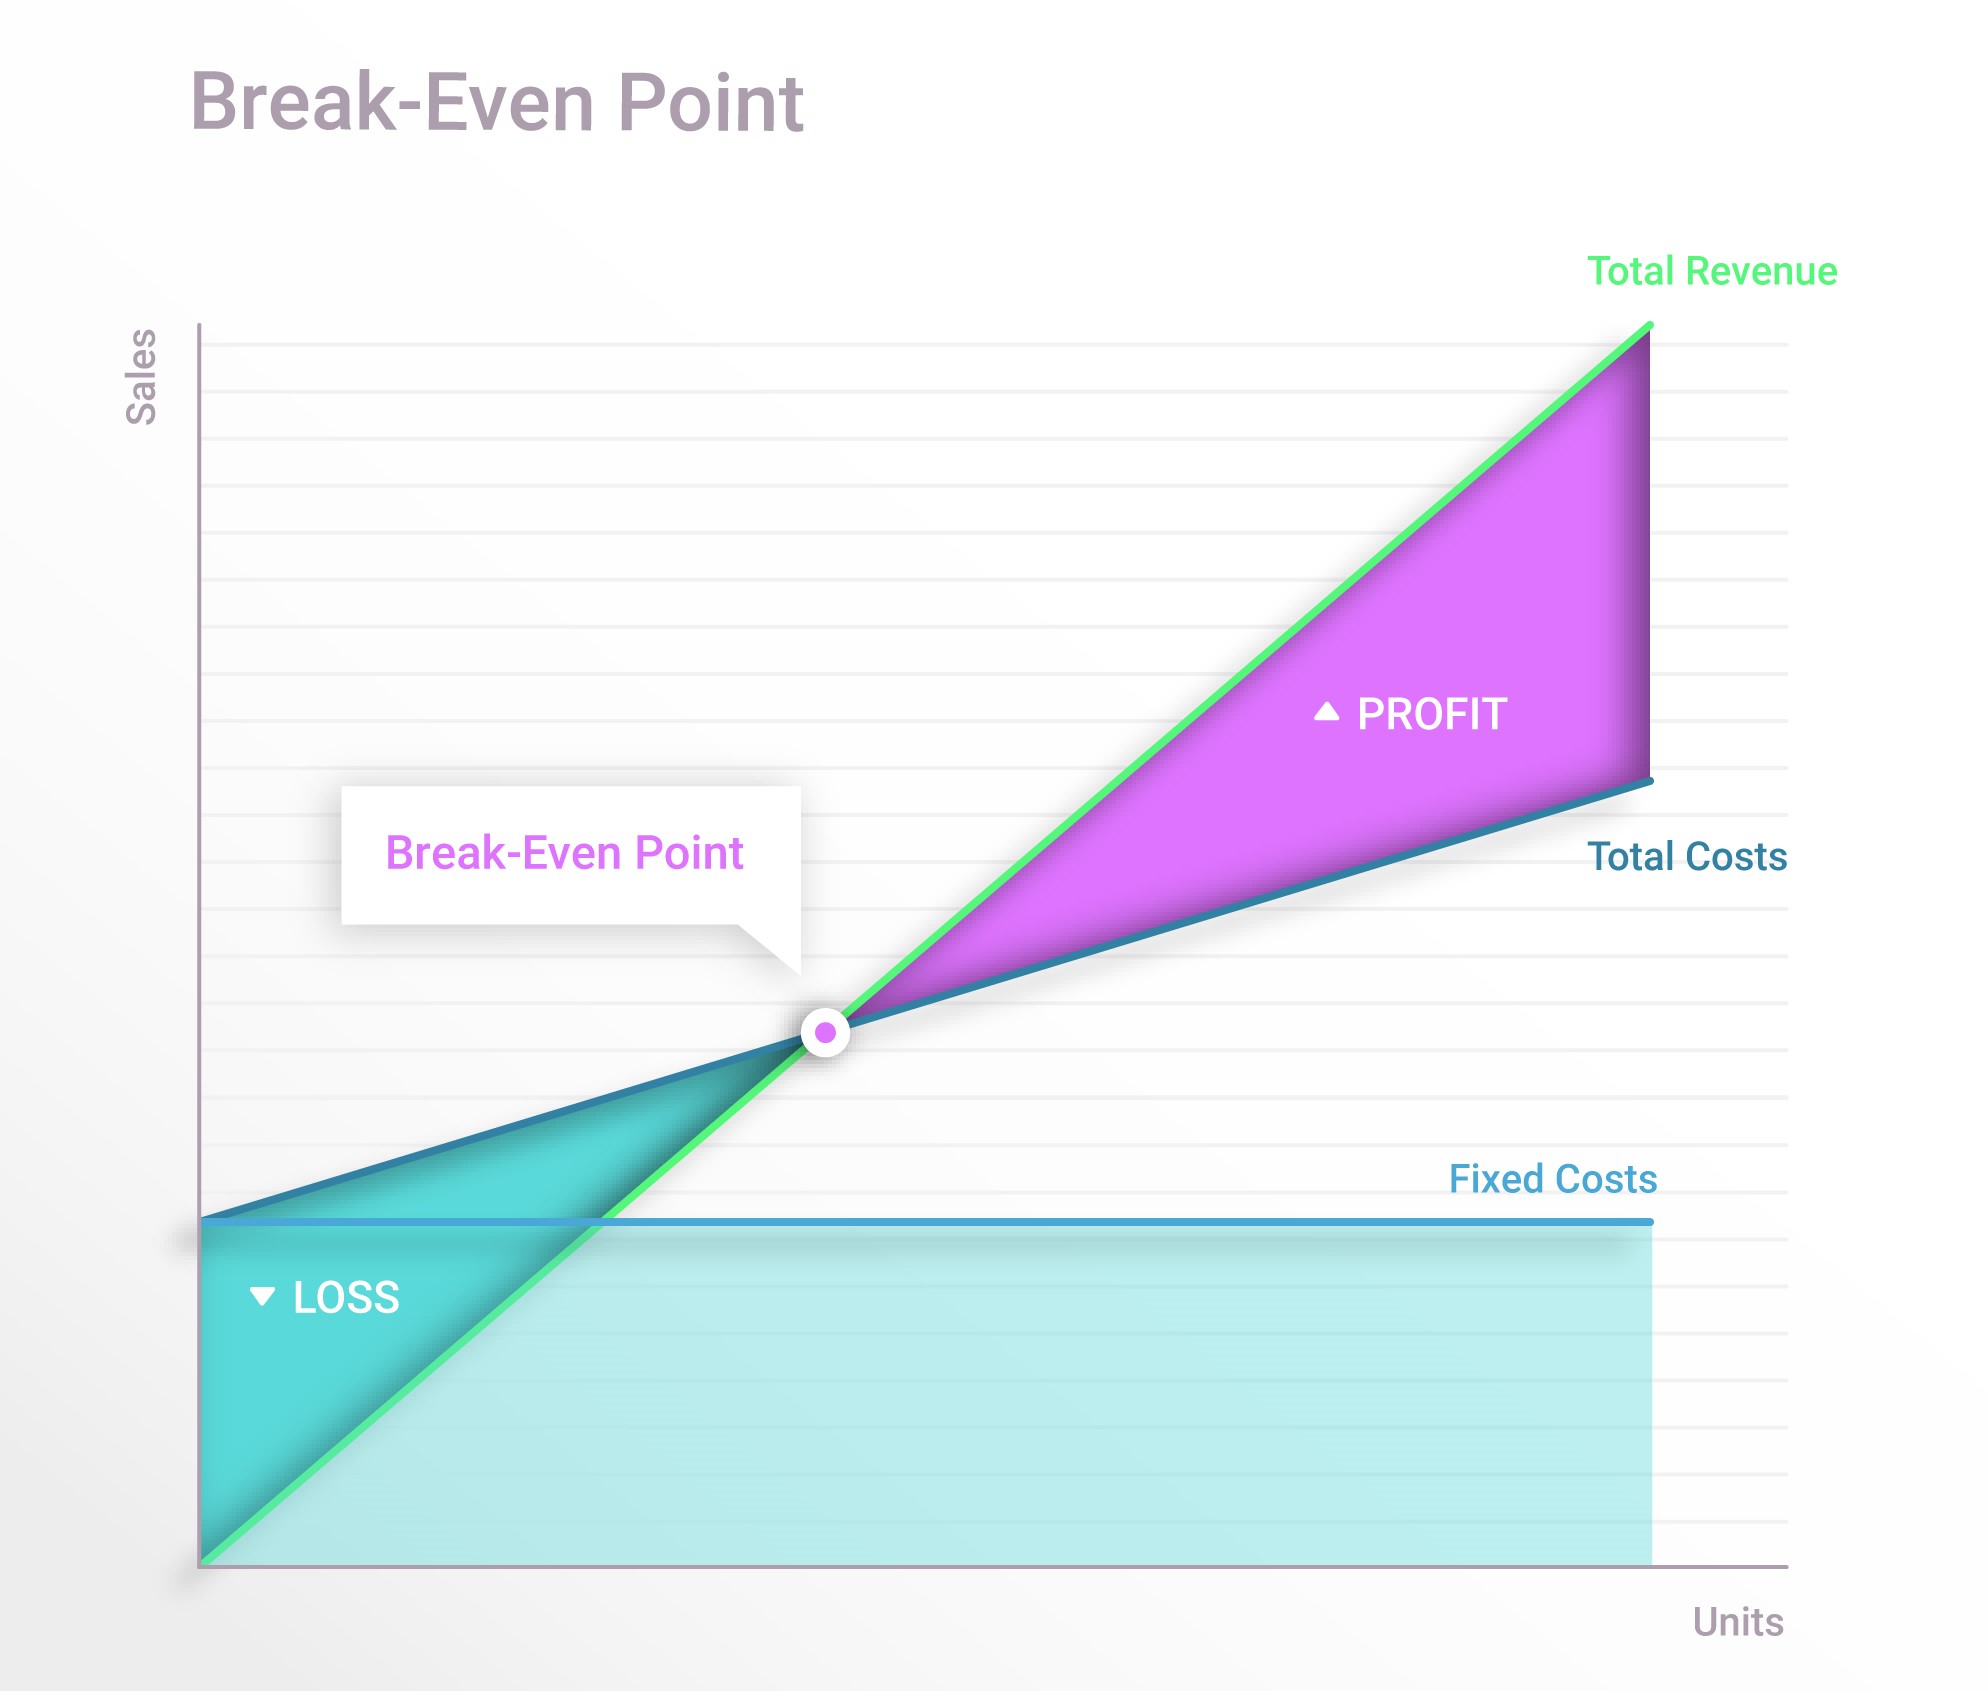
BREAK-EVEN POINT
Break-even point is the production level when the company’s revenues for a product are equal to the company’s expenses.
Break-even point shows the level of production where a business will run at “no profit, no loss”. It is very important for all businesses to achieve a break-even point for any project.
It can easily be calculated by subtracting the margin of safety from actual sales. Or it can be calculated by dividing the fixed costs of production by the price per unit minus the variable cost of production.
In investing, the break-even point is said to be achieved when the market price of an asset is the same as its original cost.
Benefits of calculating break-even point –
- It helps in the measurement of profit and losses at different levels of production and sales.
- It helps in forecasting the possible effect of changes in selling price
- It coordinates the relationship between fixed and variable costs.
Disadvantages of calculating break-even point –
- It could be time-consuming to estimate the break-even point.
- It is only applicable to a single product or a single mix of products.
- It assumes sales prices are constant at all levels.
Let’s take an example to understand break-even point:
A company has Rs. 100000 in fixed costs and a gross margin of 25%. The break-even point for the company would be 400000 (100000/0.25).
This means the company needs to generate 400000 of revenues in order to meet their fixed and variable costs. If they generate more than that, the company will have profit and if they generate less than that, the company will have a loss.
BREAK-EVEN CHART
A break-even chart is a graphical representation of the relationship between costs, volume, and profit. It depicts the break-even point in a graphical manner. A Break-even chart is a very important tool for profit planning of any business.
Let’s have a look on steps for constructing break-even chart-
- First step is to plot sales or production in units on the horizontal axis.
- Second step is to plot costs and revenues on the vertical axis.
- After that, we need to draw a fixed cost line parallel to the horizontal axis.
- Next step is to draw a line from the point of fixed costs line which is starting from the vertical axis.
- Last step is to draw a line starting from point zero and finish at the maximum point of the scale.
Now, as said above break-even point is the point where both cost and sales line intersect, and angle of incidence is the angle made from the intersection of both cost and sales line. It represents the whole area between the two lines.
MARGIN OF SAFETY
Margin of safety is the difference between actual sales and break-even point. It can be expressed as –
Margin of safety = Actual Sales – Break-Even Point
In simple words margin of safety measures the business risk. Larger the margin of safety more sound is the condition of business in respect of profit earning. A large margin of safety indicates a larger amount of profit and a lower or smaller margin of safety indicates lower profits. Margin of safety is directly related to profit. It can be shown by the following formula-
Profit = Margin of safety X P/V Ratio
Basically margin of safety is the limit to which the actual or estimated sales exceed the break-even sales.
Conclusion
At last, we can say that if the break-even sales are low and the angle of incidence is large, it means the margin of safety is high which reflects that a business is stable. If the break-even sales are higher, the angle of incidence would be narrow and the margin of safety would be low, which shows instability in a business.
Also Read: Marginal Costing and Absorption Costing, Standard Costing, Marginal Costing and Decision Making