


Project/Slides/Presentation Transcript
Subject: Financial management
Topic: RISK AND RETURN ANALYSIS OF BEER AND ALCOHOL INDUSTRY
Slide 1 – RISK AND RETURN ANALYSIS OF BEER AND ALCOHOL INDUSTRY
Slide 2 – OBJECTIVE & METHODOLOGY OF THE PROJECT
- Objective of this project is to analyze the risk and returns of our Indian beer and alcohol industry.
- We did our research on five major players of this industry. i.e.
◦ United Breweries Ltd.
◦ United Spirits Ltd.
◦ GM Breweries Ltd.
◦ Radico Khaitan Ltd.
◦ Jagatjit Industries Ltd
- Data comprises the share prices of above mentioned firms as well as the value of index of the Indian beer and alcohol industry from the time period of Mar 2009 to Apr 2015.
- S&P BSE 500 index has been taken as a proxy from the market.
- The CMIE data has been taken from PROWESS.
- BSE 500 captures almost the entire market i.e. more than 75% of the market capitalization of all the companies of Bombay Stock Exchange.
- The 91 day treasury bill rates have also been taken from RBI website as a proxy for risk free rate.
Slide 3 – OVERVIEW OF BEER & ALCOHOL INDUSTRY
- Looks after the manufacturing, distribution and sale of alcoholic drinks and beverages.
- The Indian alcohol industry is amongst the fastest growing industry in the world.
- Occupies the 3rd position in comparison to the same industry in other countries.
- Manufactures following category of products:
◦ IMFL (Indian Manufactured foreign liquor)
◦ Foreign liquor bottled in India (BII)
◦ Foreign liquor bottled in Origin (BIO)
◦ Beer
◦ Wine
- Global beer & alcohol industry is expected to exceed $1 trillion by the end of year 2015 and India will have a major contribution in this.
Slide 4 – ALCOHOL INDUSTRY ON MARKET
REGRESSION ANALYSIS:
- Value of R-Square shows that 35.75% of variation in the return of the alcohol industry is explained by the market while remaining 64.25% is due to alcohol industry specific reasons.
- Alpha of the industry is 1.345 but the P-Value is 0.150 which is greater than 0.10, thus it can be considered that the stocks of the alcohol industry firms are fairly priced.
- Value of beta is lesser than 1, it shows that the stocks are less volatile than market.
- If the return of the market changes by 1% then there will be a 0.870% change in the return of the alcohol industry.
- Good for high risk aversion investors.
- They have less risk as the overall sales of alcohol industry will never fall down.
Slide 5 – UNITED BREWERIES LTD.
- An Indian conglomerate firm headquartered in UB City, Bengaluru.
- Annual sales of over US$4.5 billion.
- Market capitalization of approximately US$12 billion.
- Markets beer under the Kingfisher brand.
- United Breweries is India’s largest producer of beer.
- 3rd largest manufacturer of spirits products in the world.
- Declared an equity dividend of 100.00% amounting to Rs 1 per share.
- Has a dividend yield of 0.11%. Dividend Payout Ratio Net Profit 2015 – 10.3 and Earning Retention Ratio 2015 – 89.7.
Slide 6 – UNITED BREWERIES LTD. ON MARKET
REGRESSION ANALYSIS:
- Value of R-Square shows that 22.27% of variation in the return of the firm is explained by the market while remaining 77.73% is due to firm specific reasons.
- Alpha of the firm is 2.482 and the P-Value is 0.078 which is lesser than 0.10, thus it can be determined that the stocks of the firm are underpriced. It’s a good buy.
- Value of beta is lesser than 1, it shows that the stocks are less volatile than market .
- If the return of the market changes by 1% then there will be a 0.940% change in the return of the firm.
- Good for high risk aversion investors.
- They have less risk as their sales will never fall down.
Slide 7 – UNITED BREWERIES LTD. ON ALCOHOL INDUSTRY
REGRESSION ANALYSIS:
- Value of R-Square shows that 51.09% of variation in the return of the firm is explained by the alcohol industry while remaining 48.91% is due to firm specific reasons.
- Alpha of the firm is 1.272 but the P-Value is 0.259 which is greater than 0.10, thus it can be considered that the stocks of the firm are fairly priced within the alcohol industry.
- Value of beta is lesser than 1, it shows that the stocks are less volatile than the industry.
- If the return of the alcohol industry changes by 1% then there will be a 0.978% change in the return of the firm.
- Good for high risk aversion investors.
- They have less risk as the overall sales of alcohol industry will never fall down.
Slide 8 – UNITED SPIRITS LTD.
- World’s second-largest spirits company by volume.
- Subsidiary of the Diageo, and headquartered at UB Tower in Bengaluru.
- Exports its products to over 37 countries.
- Has 140 liquor brands, of which 5 brands each sell is more than 10 million cases annually.
Slide 9 – UNITED SPIRITS LTD. ON MARKET
REGRESSION ANALYSIS:
- Value of R-Square shows that 18.59% of variation in the return of the firm is explained by the market while remaining 81.41% is due to firm specific reasons.
- Alpha of the firm is 1.638 but the P-Value is 0.306 which is greater than 0.10, thus it can be considered that the stocks of the firm are fairly priced.
- Value of beta is lesser than 1, it shows that the stocks are less volatile than market .
- If the return of the market changes by 1% then there will be a 0.959% change in the return of the firm.
- Good for high risk aversion investors.
- They have less risk as their sales will never fall down.
Slide 10 – UNITED SPIRITS LTD. ON ALCOHOL INDUSTRY
REGRESSION ANALYSIS:
- Value of R-Square shows that 73.37% of variation in the return of the firm is explained by the alcohol industry while remaining 26.63% is due to firm specific reasons.
- Alpha of the firm is -0.338 but the P-Value is 0.714 which is greater than 0.10, thus it can be considered that the stocks of the firm are fairly priced within the alcohol industry.
- Value of beta is greater than 1, it shows that the stocks are more volatile than the industry.
- If the return of the alcohol industry changes by 1% then there will be a 1.309% change in the return of the firm.
- Good for risk taking investors for stocks of alcohol firms.
- The firm has more risk within the industry due to close cut competition.
Slide 11 – GM BREWERIES LTD.
- An India-based company that manufactures and markets Country Liquor & Indian Made Foreign Liquor.
- Brands include G.M.SANTRA, G.M.DOCTOR, G.M.LIMBU PUNCH etc.
- The company has an annual revenue of Rs. 3.32 billion.
- Their revenue per share is Rs. 283.48, Dividend Payout Ratio Net Profit 2015 – 15.7 and Earning Retention Ratio 2015 – 84.3.
Slide 12 – GM BREWERIES LTD. ON MARKET
REGRESSION ANALYSIS:
- Value of R-Square shows that 15.94% of variation in the return of the firm is explained by the market while remaining 84.06% is due to firm specific reasons.
- Alpha of the firm is 0.23 but the P-Value is 0.88 which is greater than 0.10, thus it can be considered that the stocks of the firm are fairly priced.
- Value of beta is lesser than 1, it shows that the stocks are less volatile than market.
- If the return of the market changes by 1% then there will be a 0.890% change in the return of the firm.
- Good for high risk aversion investors.
- They have less risk as their sales will never fall down.
Slide 13 – GM BREWERIES LTD. ON ALCOHOL INDUSTRY
REGRESSION ANALYSIS:
- Value of R-Square shows that 15.99% of variation in the return of the firm is explained by the alcohol industry while remaining 84.01% is due to firm specific reasons.
- Alpha of the firm is -0.161 but the P-Value is 0.921 which is greater than 0.10, thus it can be considered that the stocks of the firm are fairly priced within the alcohol industry.
- Value of beta is lesser than 1, it shows that the stocks are less volatile than the industry.
- If the return of the alcohol industry changes by 1% then there will be a 0.613% change in the return of the firm.
- Good for high risk aversion investors.
- They have less risk as the overall sales of alcohol industry will never fall down.
Slide 14 – RADICO KHAITAN LTD.
- Formerly known as Rampur Distillery & Chemical Company Ltd.
- Fourth largest Indian liquor company.
- Manufactures industrial alcohol, Indian Made Foreign Liquor, Country Liquor and fertilizers.
- Sold in more than 60 countries, including USA, Canada etc.
- Their Dividend Payout Ratio Net Profit 2015 – 15.7 and Earning Retention Ratio 2015 – 84.3.
Slide 15 – RADICO KHAITAN LTD. ON MARKET
REGRESSION ANALYSIS:
- Value of R-Square shows that 18.95% of variation in the return of the firm is explained by the market while remaining 81.05% is due to firm specific reasons.
- Alpha of the firm is -0.438 but the P value is 0.709 which is greater than 0.10, thus it can be considered that the stocks of the firm are fairly priced.
- Value of beta is lesser than 1, it shows that the stocks are less volatile than market .
- If the return of the market changes by 1% then there will be a 0.715% change in the return of the firm.
- Good for high risk aversion investors.
- They have less risk as their sales will never fall down.
Slide 16 – RADICO KHAITAN LTD. ON ALCOHOL INDUSTRY
REGRESSION ANALYSIS:
- Value of R-Square shows that 19.28% of variation in the return of the firm is explained by the alcohol industry while remaining 80.72% is due to firm specific reasons.
- Alpha of the firm is -0.767 but the P-Value is 0.520 which is greater than 0.10, thus it can be considered that the stocks of the firm are fairly priced within the alcohol industry.
- Value of beta is lesser than 1, it shows that the stocks are less volatile than the industry.
- If the return of the alcohol industry changes by 1% then there will be a 0.496% change in the return of the firm.
- Good for high risk aversion investors.
- They have less risk as the overall sales of alcohol industry will never fall down.
Slide 17 – JAGATJIT INDUSTRIES LTD.
- An India-based multi-product company which is engaged in the manufacture of alcoholic beverages, malted milkfood and glass containers.
- Operates in four segments: beverages, food, packaging and others.
- Manufactures and supplies bottled Indian Made Foreign Liquor, Country Liquor, industrial alcohol and their licensing use.
- Licensing of its (IMFL) brands.
- Manufacturing and supplies of food products and providing services for manufacture of food products.
- Manufacturing and supplies of glass and plastic containers to open market and for its own consumption.
- And others segment includes sale of petroleum products.
- Their Dividend Payout Ratio Net Profit 2015 – 0 and Earning Retention Ratio 2015 – 100.
Slide 18 – JAGATJIT INDUSTRIES LTD. ON MARKET
REGRESSION ANALYSIS:
- Value of R-Square shows that 38.44% of variation in the return of the firm is explained by the market while remaining 61.56% is due to firm specific reasons.
- Alpha of the firm is -1.619 but the P value is 0.121 which is greater than 0.10, thus it can be considered that the stocks of the firm are fairly priced.
- Value of beta is greater than 1, it shows that the stocks are more volatile than market .
- If the return of the market changes by 1% then there will be a 1.030% change in the return of the firm.
- Good for risk taking investors.
- They have high risk as their sales may have dropped due to having less variety.
Slide 19 – JAGATJIT INDUSTRIES LTD. ON ALCOHOL INDUSTRY
REGRESSION ANALYSIS:
- Value of R-Square shows that 23.18% of variation in the return of the firm is explained by the alcohol industry while remaining 76.82% is due to firm specific reasons.
- Alpha of the firm is -1.70 but the P-Value is 0.150 which is greater than 0.10, thus it can be considered that the stocks of the firm are fairly priced within the alcohol industry.
- Value of beta is lesser than 1, it shows that the stocks are less volatile than the industry.
- If the return of the alcohol industry changes by 1% then there will be a 0.549% change in the return of the firm.
- Good for high risk aversion investors.
- They have less risk as the overall sales of alcohol industry will never fall down.
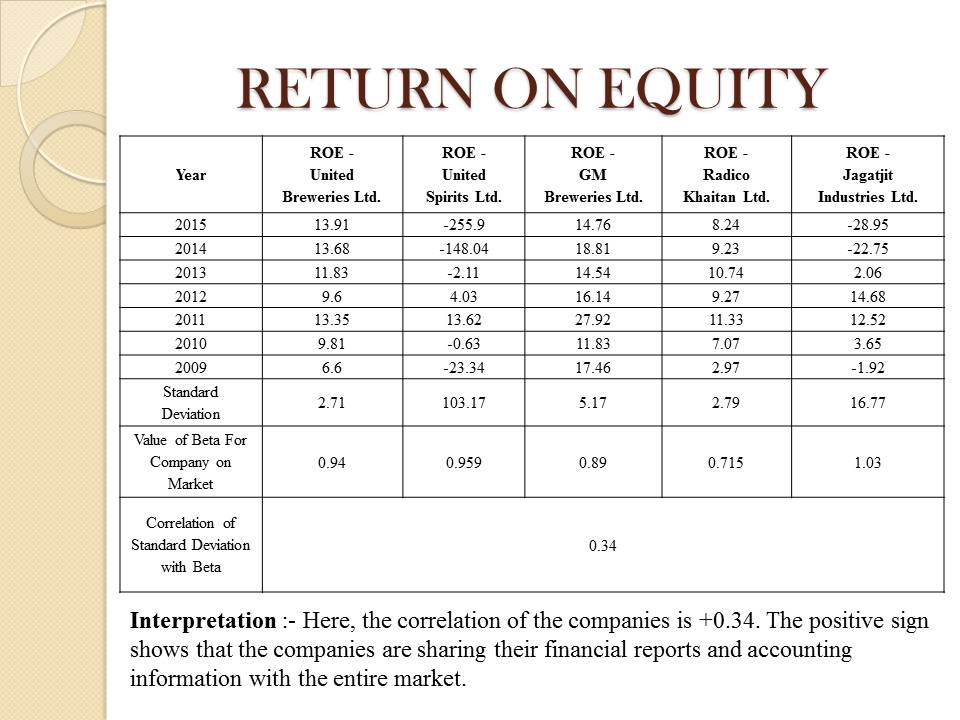
Slide 20 – RETURN ON EQUITY – RISK AND RETURN ANALYSIS OF BEER AND ALCOHOL INDUSTRY
| Year | ROE – United Breweries Ltd. | ROE – United Spirits Ltd. | ROE – GM Breweries Ltd. | ROE – Radico Khaitan Ltd. | ROE – Jagatjit Industries Ltd. |
| 2015 | 13.91 | -255.9 | 14.76 | 8.24 | -28.95 |
| 2014 | 13.68 | -148.04 | 18.81 | 9.23 | -22.75 |
| 2013 | 11.83 | -2.11 | 14.54 | 10.74 | 2.06 |
| 2012 | 9.6 | 4.03 | 16.14 | 9.27 | 14.68 |
| 2011 | 13.35 | 13.62 | 27.92 | 11.33 | 12.52 |
| 2010 | 9.81 | -0.63 | 11.83 | 7.07 | 3.65 |
| 2009 | 6.6 | -23.34 | 17.46 | 2.97 | -1.92 |
| Standard Deviation | 2.71 | 103.17 | 5.17 | 2.79 | 16.77 |
| Value of Beta For Company on Market | 0.94 | 0.959 | 0.89 | 0.715 | 1.03 |
| Correlation of Standard Deviation with Beta | 0.34 | ||||
Slide 21 – NATURE OF THE INDUSTRY AND PRODUCT
- Face high risk mainly on account of the high taxes and innumerable regulations.
- Liquor companies suffer from low pricing flexibility.
- The price-sensitive nature of the industry ensures a high degree of competition.
- Alcohol is an addictive product and it has become a necessity for its consumers.
- Even if the price increases or people’s earning decreases, people still keep buying alcohol and they tend to shift from premium brands to lower level brands.
- In some cases people even shift to country liquor.
- Indicates that most Beer and Alcohol firms have low market risk as well as low market specific risk.
Slide 22 – RISK AND RETURN ANALYSIS OF BEER AND ALCOHOL INDUSTRY