Meaning of Ratio Analysis
Ratio analysis is the process of analysis and interpretation of the figures appearing in the financial statement (i.e. profit and loss account, balance sheet, and fund flow statement etc.)
It is a very important tool useful for measuring the performance of an organization. It enables users like shareholders, investors, creditors, government, and analysts, etc. to get a better understanding of financial statements.
Advantages of Ratio Analysis
- Decision making – Ratio analysis helps in validating the financial, investment and operating decisions of the firm. They summarize the financial statement into comparative figures thus helping the management to compare and evaluate the financial position of the firm and help them in taking the right decisions.
- Simplifies complex accounting – Ratio analysis helps in simplifying the complex accounting statements and financial data into simple ratios of operating efficiency, financial efficiency, solvency, long term positions, etc.
- Identify problem areas – Ratio analysis help identify problem areas and bring the attention of the management to such areas. Some of the information is lost in the pinpoint such problems.
- Comparative – it allows the company to conduct comparisons with other firms, industry standards, intra-firm comparisons, etc. this will help the organization better understand its fiscal position in the economy.
- Easy to understand – Ratio analysis makes it easy to understand the data because it represents the data in a plain form. A user can decide an enterprise by just looking at a few numbers rather than understanding the complete financial statement.
Limitations of Ratio Analysis
- Window dressing – The firm can make some yearly changes to their financial statements, to improve their ratios. Then the ratios end up being nothing but window dressing.
- Ignores price level changes – Many ratios are calculated using historical costs, and they overlook the changes in price level between the periods. This does not reflect the correct financial situation.
- Quantitative only – Accounting ratios completely ignore the qualitative aspects of the firm. They only take into consideration the monetary aspects.
- Different accounting policies – different accounting policies regarding the valuation of inventories, charging depreciation, etc. make the accounting data and accounting ratios of two firms non-comparable.
- Casual relationship is a must – Proper care should be taken to study only such figures as have a cause and effect relationship otherwise ratios will only be misleading.
Classification of Ratios
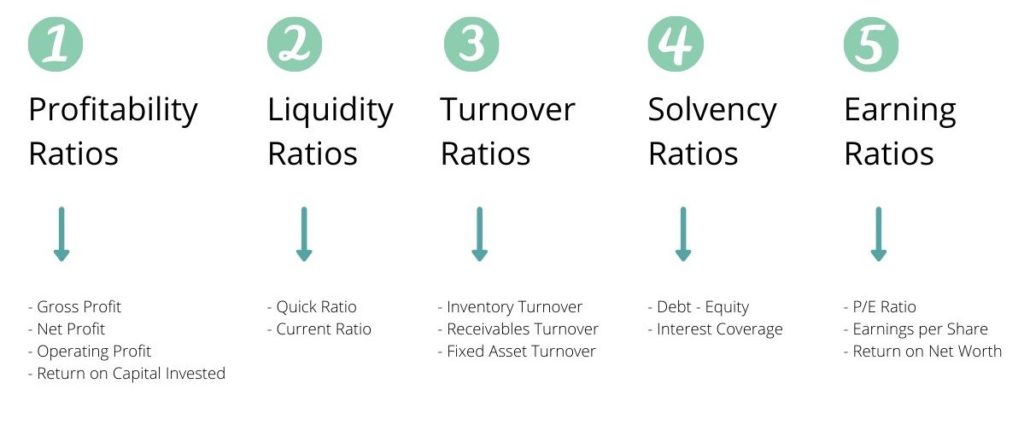
Profitability Ratios
This type of ratio analysis suggests the returns that are generated from the business with the capital invested.
Profitability ratios can be further divided into four categories-
GROSS PROFIT RATIO – It represents the operating profit of the company after adjusting the cost of the goods that are been sold. Higher the gross profit ratio, lower the cost of goods sold and greater the satisfaction of the management.
Gross profit ratio = Gross profit/Net profit X 100
NET PROFIT RATIO – It represents the overall profitability of the company after deducting all the cash and cash expenses. Higher the net profit ratio higher the net worth and stronger the balance sheet.
Net Profit after tax/Net Sales X 100
OPERATING PROFIT RATIO- It represents the soundness of the company and the ability to pay off its debt obligations.
Operating profit ratio = Earnings before interest and tax/Net sales X 100
RETURN ON CAPITAL EMPLOYED – Return capital employed represents the profitability of the company with the capital invested in the business.
Return on capital employed = Earnings before interest and tax/capital employed
Solvency ratios
These ratio analysis types suggest whether the company is solvent and is able to pay off the debts of the lenders or not.
Solvency ratio can be divided into two types-
DEBT-EQUITY RATIO – This ratio represents the leverage of the company. A low debt-equity ratio means that the company has a lesser amount of debt on its books and is more equity diluted. The ideal debt-equity ratio of any company should be 2:1.
Debt equity ratio= Total debt/ Shareholders fund
Where,
Total debt = Long term debt + Short term debt + Other fixed payments
Shareholders fund = Equity share capital+ Reserves+ Preference share capital – fictitious assets
INTEREST COVERAGE RATIO – It represents how many times the company’s profits are capable of covering its interest expenses. It also signifies the solvency of the company in the near future. Higher the ratio of more comfort to the shareholders and lenders for the smooth functioning of the business operations.
Interest coverage ratio = Earnings before interest and tax/Interest expenses
Liquidity ratio
This ratio represents whether the company has enough liquidity to meet its short term obligations or not. Higher the ratio more cash-rich the company.
Liquidity ratio can be divided into two categories –
QUICK RATIO – It represents how cash rich the company is to pay off its immediate liabilities in the short term.
Quick ratio = Quick Assets (cash and cash equivalents + marketable securities + accounts receivable) / Current liabilities
CURRENT RATIO – It represents the liquidity of the company in order to meet its obligations in the next 12 months. Higher the current ratio, stronger the company to pay its current liabilities.
Current ratio = Current assets/Current liabilities
Turnover ratio
These ratios signify how efficiently the assets and liabilities of the company are been used to generate revenues.
Turnover ratio can be divided into three categories-
INVENTORY TURNOVER RATIO – It represents how fast the company is able to convert its inventory into sales.
Inventory turnover ratio = Cost of goods sold/ Average inventories
RECEIVABLES TURNOVER RATIO – This ratio reflects the efficiency of the company to collect its receivables. It signifies how many times the receivables are converted into cash.
Receivables turnover ratio = Net credit sales/ average receivables
FIXED ASSET TURNOVER RATIO – It represents the efficiency of the company to generate revenue from its assets. It is a return on investment in fixed assets.
Fixed assets turnover ratio = net sales/ average fixed assets
Earning ratios
This ratio analysis type speaks about the returns that the company generates for its shareholders and investors.
Earning ratio can be divided into three categories-
P/E RATIO – This ratio represents the earnings multiple of the company. A high P/E ratio is a positive sign for the company since it gets a high valuation in the market.
P/E Ratio = Market price per share/ earnings per share
EARNINGS PER SHARE – It represents the monetary value of the earnings of each shareholder. It is one of the major components looked at by analysts while investing in the equity market.
Earnings per share= (net income – preferred dividends)/(weighted average of shares outstanding)
RETURN ON NET WORTH – This ratio represents how much profit the company generated with the invested capital from equity and preference shareholders both.
Return on net worth = net profit/ equity shareholders fund
Where,
Equity shareholders fund = equity+ preference+ reserves – fictitious assets